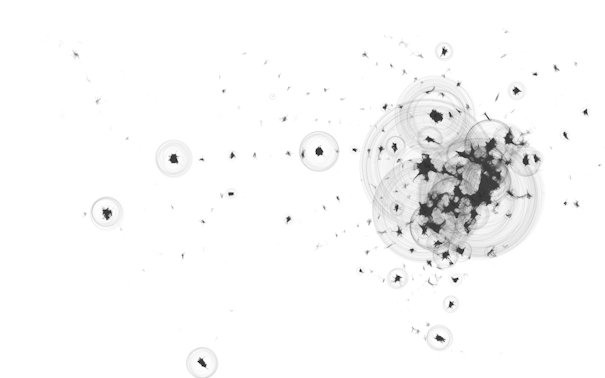
RELATION
I visualized a database of 300,000 restaurants in Tokyo based on relationships.
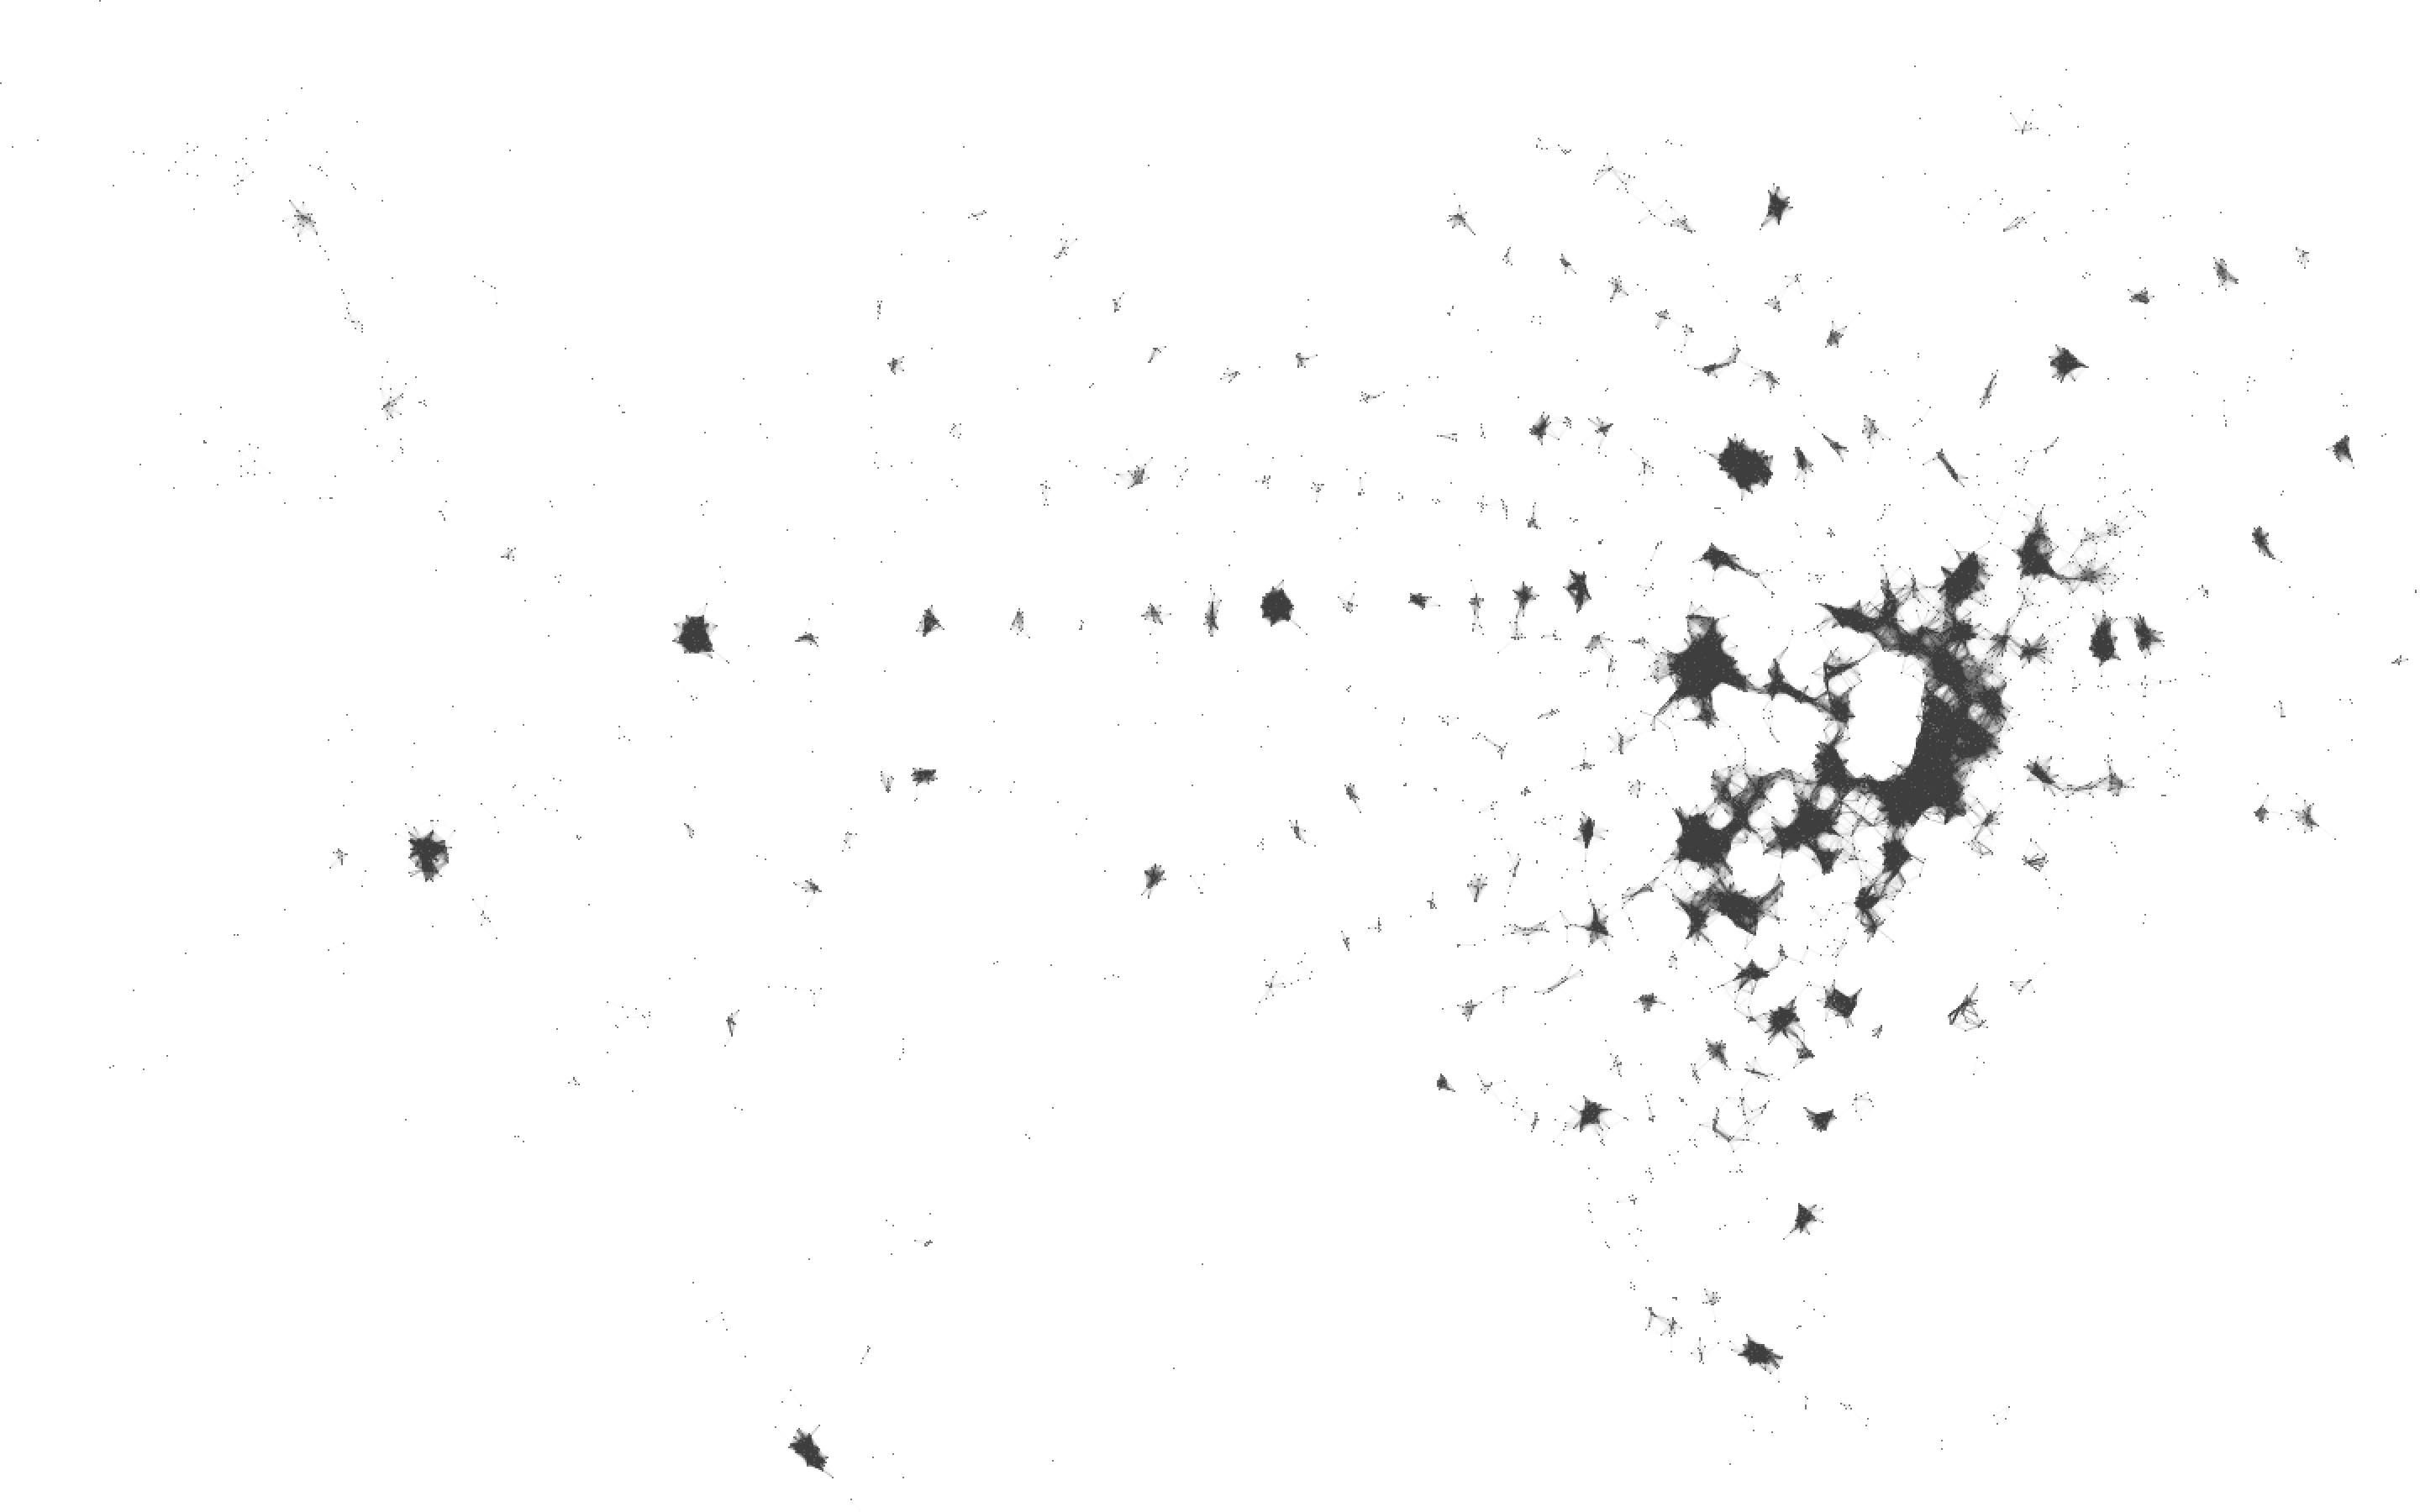
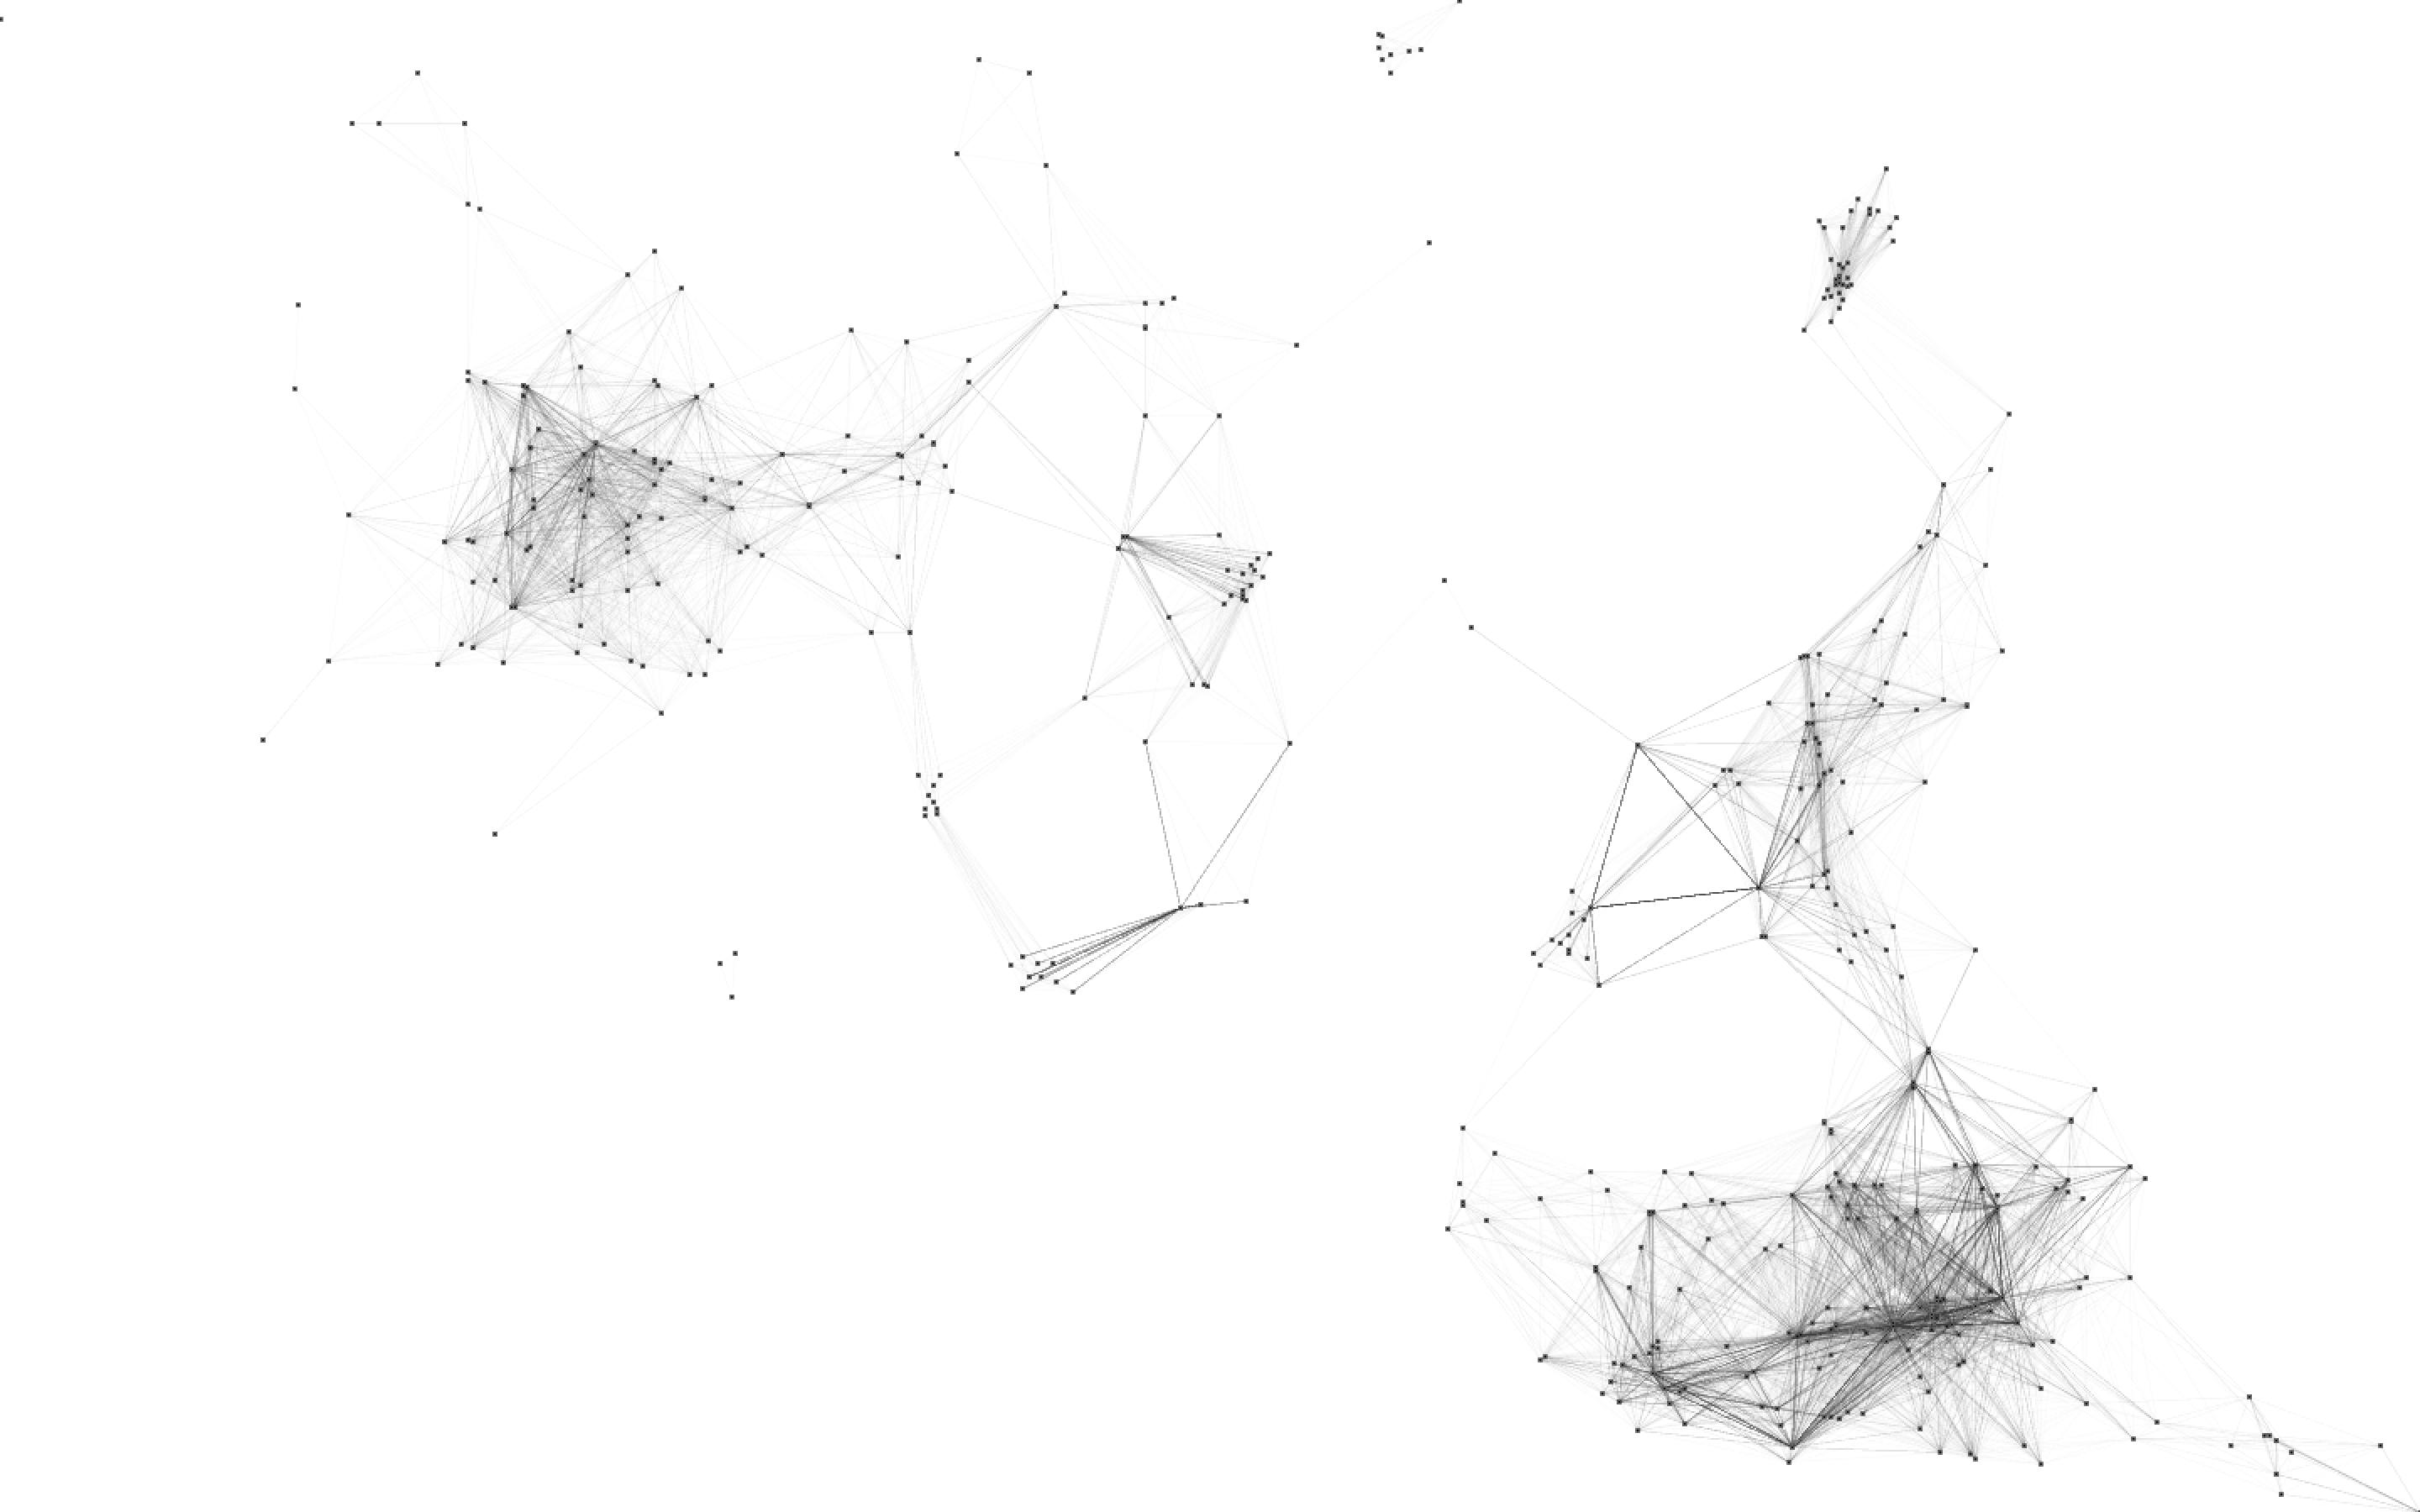

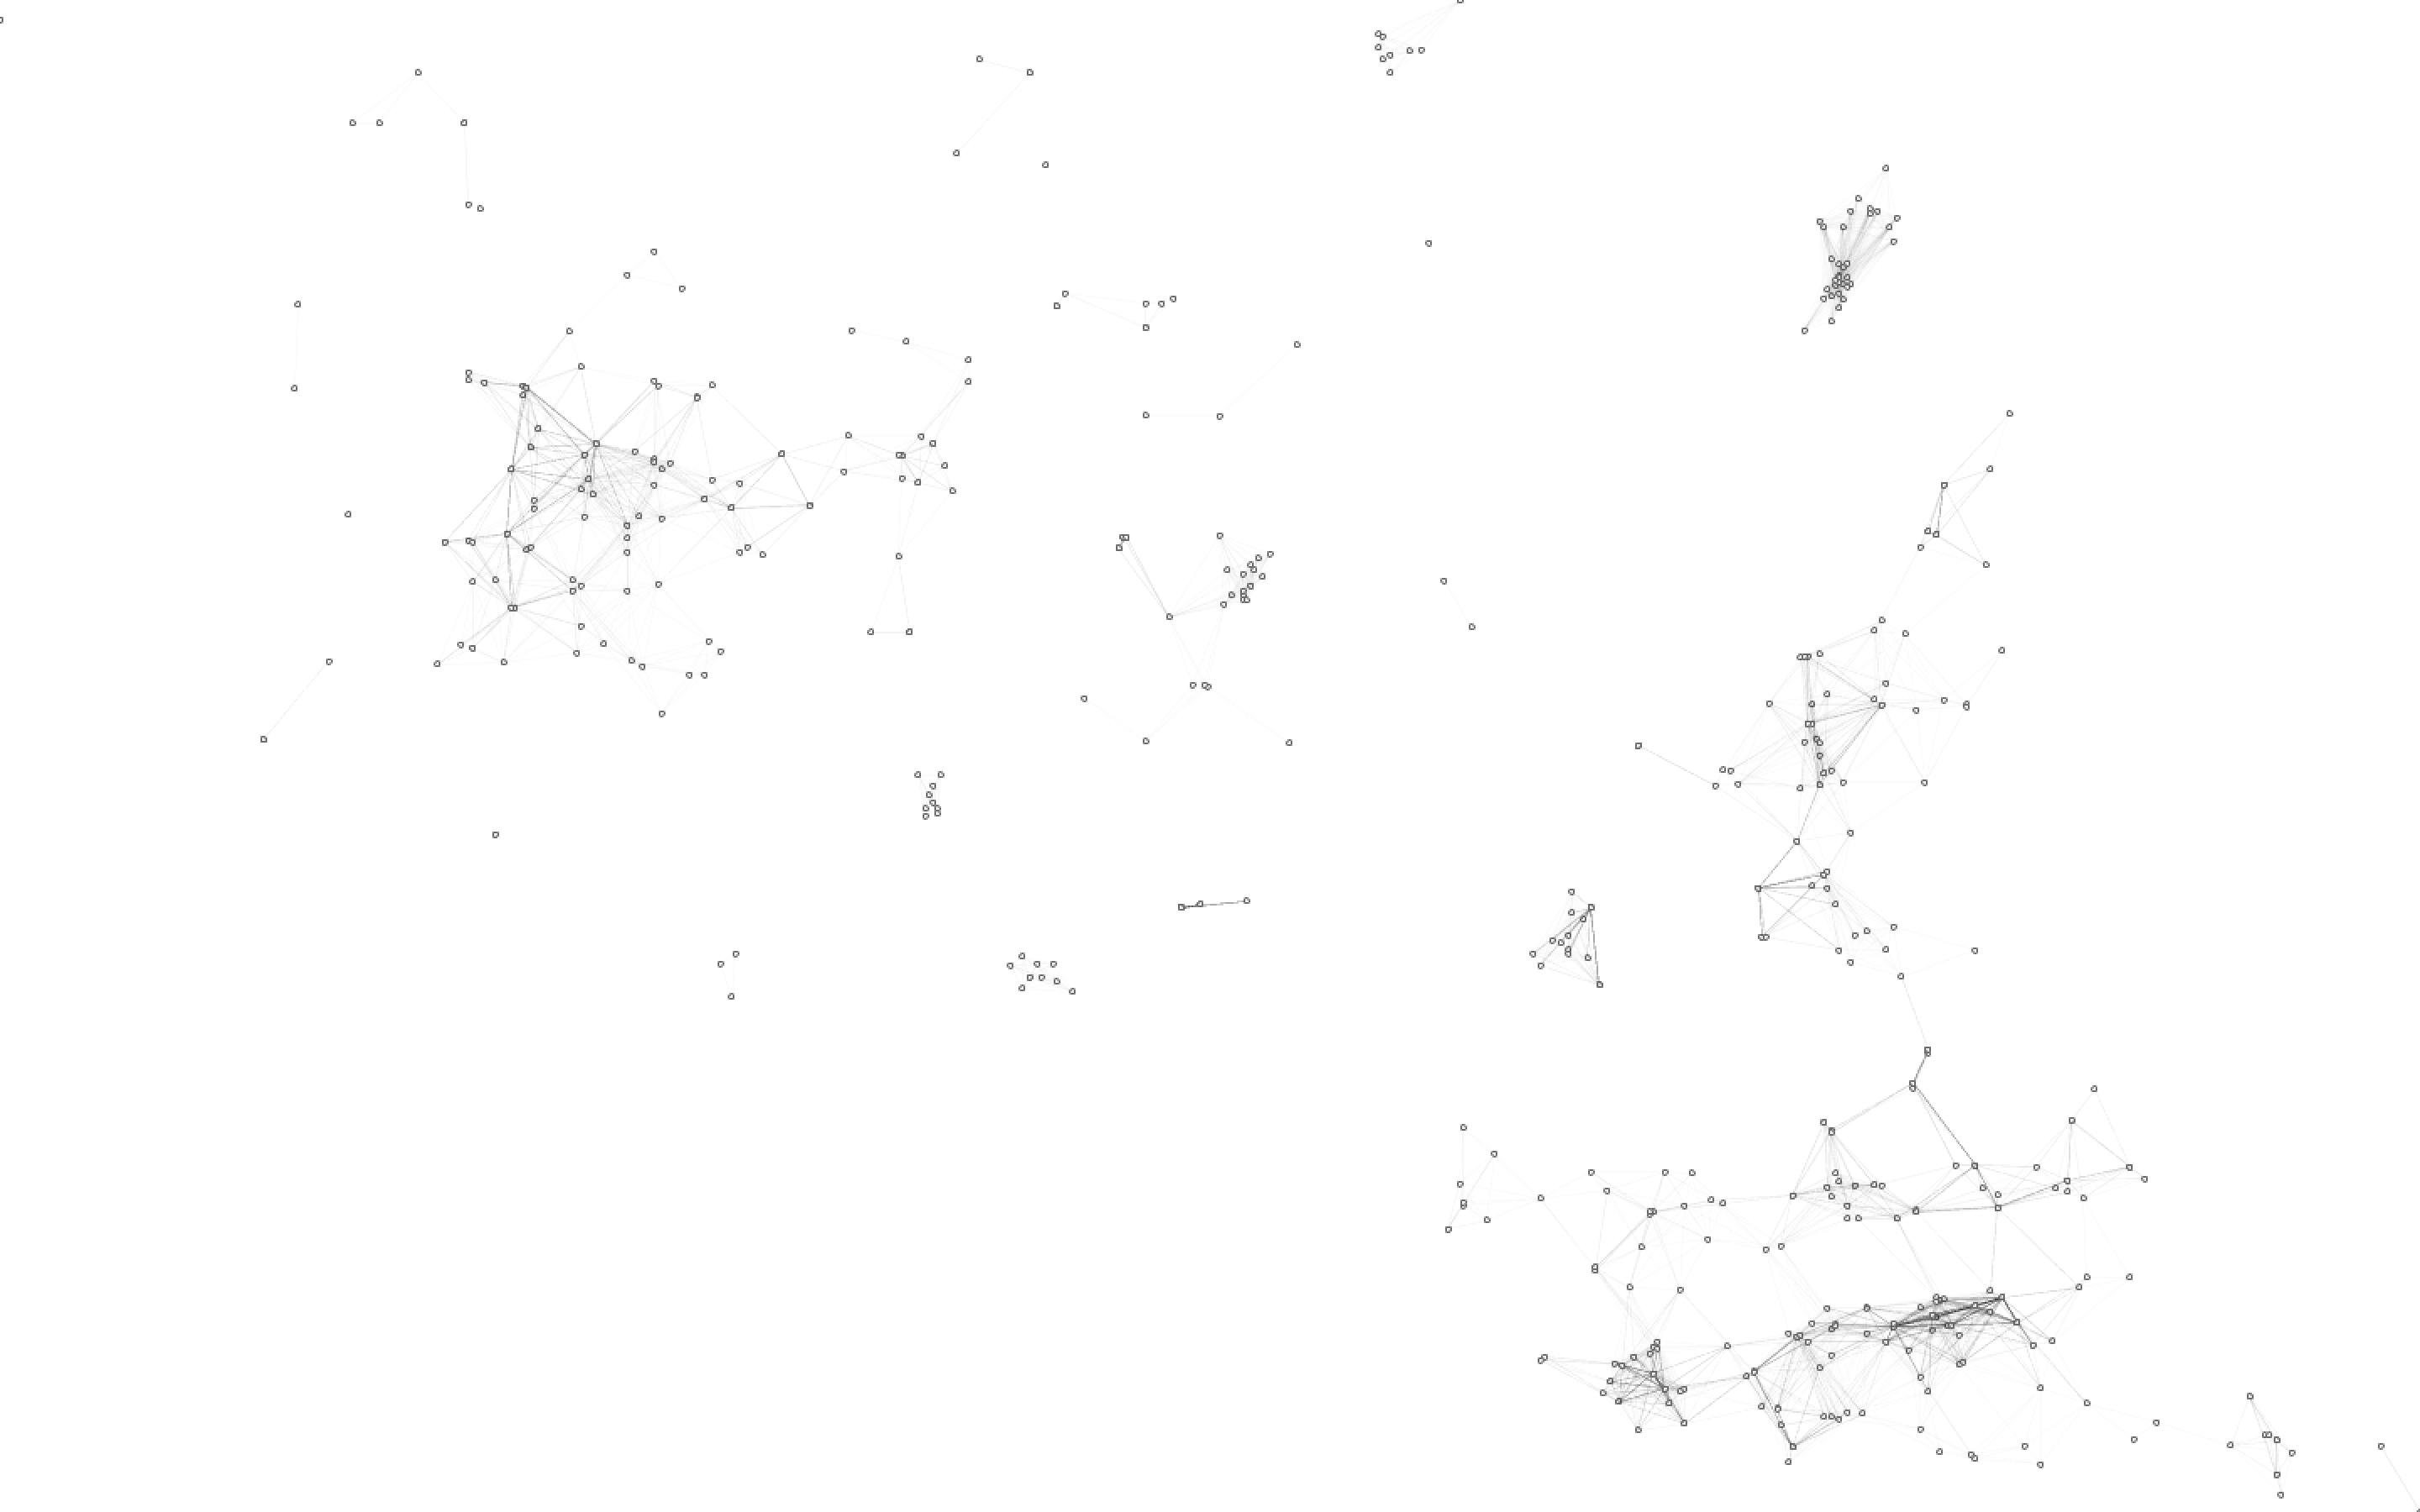
The contents of the database include coordinates, genres, foods, nearest stations, and the like. We tried to visualize the relationship between neighboring restaurants, which might be hostile or even effective.
- Connect the coordinates of shops within the specified range with a line.
- Express the magnitude of the impact as a circle.
- Execute the process continuously for 1 and 2.
Execution takes a considerable amount of time due to the large amount of data. Different perspectives could be obtained by visualizing each region. It would be possible to research how relationships affected and changed by performing visualizations at regular intervals in the future.


2018, data visualization, SQLite, processing